
Body Mass Index Chart: Adult Ranges, Formula, and What BMI Misses

Last updated: September 30, 2026
Quick Answer
A body mass index chart sorts adults into four weight categories, underweight, healthy weight, overweight, and obesity, using one number calculated from height and weight. The same adult BMI ranges apply to men and women aged 20 and older; sex, muscle mass, pregnancy, and life stage change how that number should be interpreted, not the ranges themselves. BMI is a screening tool, not a diagnosis, and it works best alongside waist measurement and an honest look at fitness and daily function.
Key Takeaways
- A body mass index chart uses one shared set of adult ranges: below 18.5 underweight, 18.5 to 24.9 healthy, 25.0 to 29.9 overweight, 30.0 and above obesity, for both men and women aged 20 and up [1][7].
- The BMI formula is weight in kilograms divided by height in meters squared, or weight in pounds divided by height in inches squared, multiplied by 703.
- BMI cannot tell the difference between muscle and fat, so it can overstate risk in muscular adults and understate risk in people with low muscle mass [3][10].
- Children and teens are never plotted on the adult chart; the CDC uses age- and sex-specific growth percentiles for ages 2 to 19 [7].
- Waist circumference and waist-to-height ratio catch some risk that BMI alone can miss, which is why current expert guidance treats BMI as a first step, not the last word [5][2].
- Pregnancy, recent postpartum recovery, and normal age-related muscle loss all affect how a single BMI number should be read, without changing the underlying adult ranges.
- For beginners starting walking or cardio, BMI is a reasonable starting reference point, not a target to chase or a judgment on effort.
Table of Contents
- Adult BMI Chart
- What Is BMI and How Does the Formula Work
- BMI Chart for Women: Same Adult Ranges, Different Contexts
- BMI Chart for Men: Same Adult Ranges, Different Contexts
- When BMI Is Useful
- What BMI Misses: Muscle, Body Composition, Waist Measurement, and Life Stage
- BMI vs Body-Fat Percentage
- Using BMI as a Starting Point for Walking and Cardio
- When to Seek Individual Advice
- FAQ
Adult BMI Chart
The adult body mass index chart has four categories that apply the same way to every adult aged 20 and older, regardless of sex: underweight (below 18.5), healthy weight (18.5 to 24.9), overweight (25.0 to 29.9), and obesity (30.0 and above) [1][7]. These thresholds have not changed in the most recent public health guidance, and no major health authority publishes separate adult cutoffs for men and women.
Here is what those categories look like translated into approximate weight ranges at common adult heights. These numbers are calculated directly from the standard BMI formula, so you can check your own height against them without doing any math.
| Height | Healthy weight (BMI 18.5-24.9) | Overweight (BMI 25.0-29.9) | Obesity (BMI 30.0+) |
|---|---|---|---|
| 4’10” (58 in) | 89-119 lbs | 120-143 lbs | 144 lbs and up |
| 5’1″ (61 in) | 98-131 lbs | 132-158 lbs | 159 lbs and up |
| 5’4″ (64 in) | 108-145 lbs | 146-174 lbs | 175 lbs and up |
| 5’7″ (67 in) | 118-159 lbs | 160-191 lbs | 192 lbs and up |
| 5’10” (70 in) | 129-173 lbs | 174-208 lbs | 209 lbs and up |
| 6’1″ (73 in) | 140-189 lbs | 190-226 lbs | 227 lbs and up |
| 6’4″ (76 in) | 152-204 lbs | 205-246 lbs | 247 lbs and up |
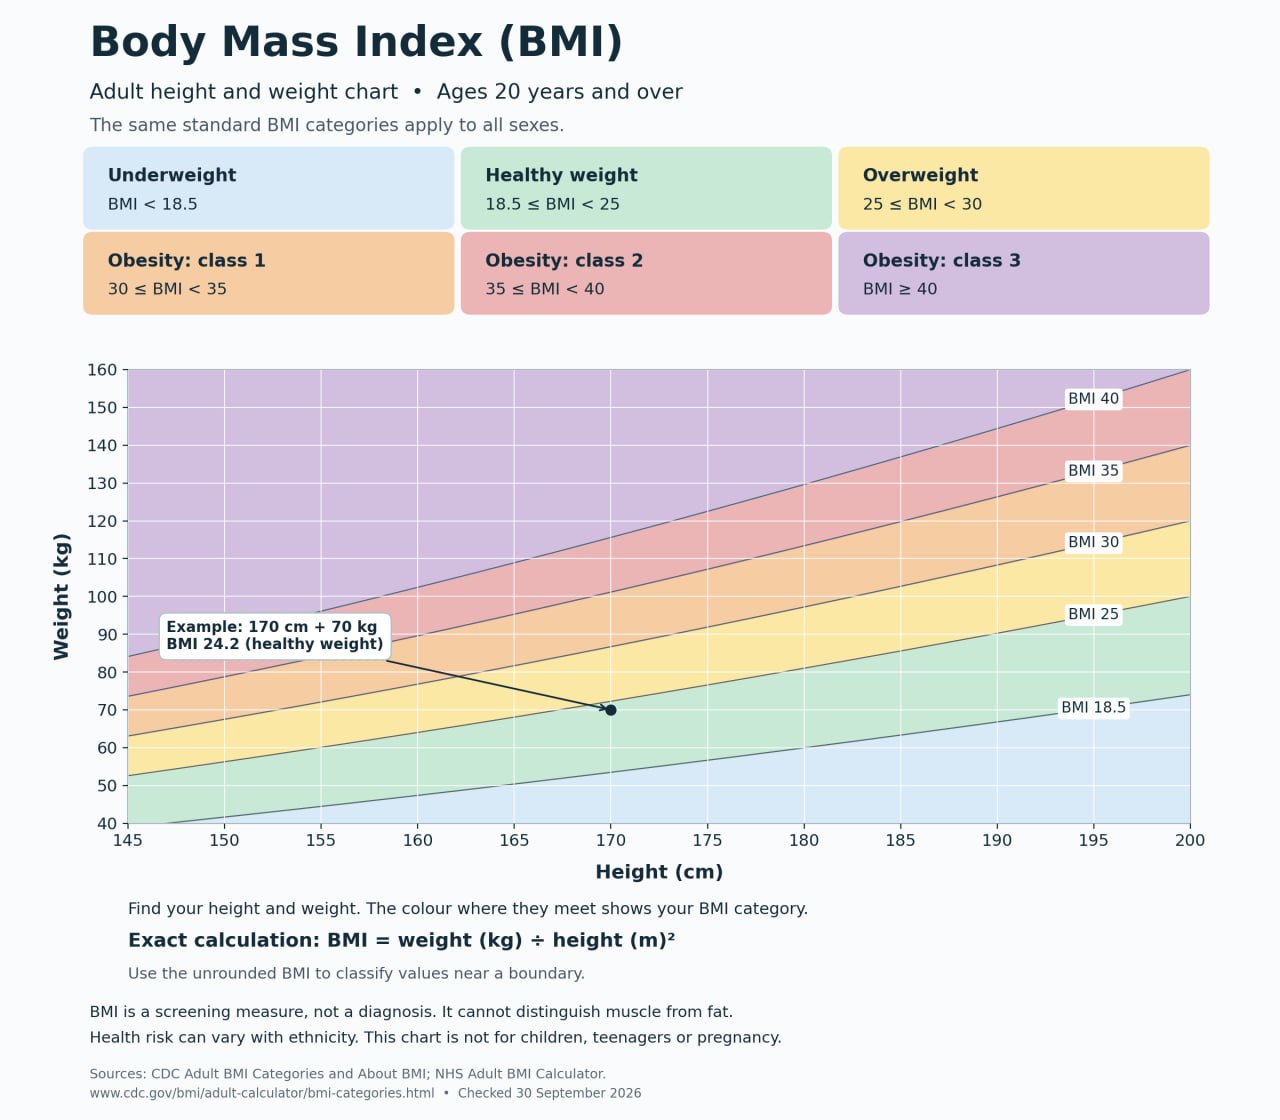
The main takeaway is this: find your height in that table, note where your weight sits, and treat the result as a starting point, not a verdict. If your number falls close to a boundary line, that is normal and worth mentioning to a doctor rather than worrying over on your own. A body mass index chart is a screening tool built for population-level tracking, and it reads the same for a 45-year-old and a 65-year-old adult, though how that number should be interpreted does shift with age, which we cover further down.
What Is BMI and How Does the Formula Work?
Body mass index is a simple ratio of weight to height, calculated with one formula and expressed as a single number. In plain English, BMI answers one narrow question: given your height, is your weight in a typical, low, or high range compared with population data, nothing more.
The metric formula: BMI = weight in kilograms ÷ (height in meters)²
Example: someone who is 1.67 meters tall (about 5’6″) and weighs 70 kilograms: 70 ÷ (1.67 × 1.67) = 70 ÷ 2.79 = 25.1
The US (imperial) formula: BMI = [weight in pounds ÷ (height in inches)²] × 703
Example: someone who is 66 inches tall (5’6″) and weighs 160 pounds: [160 ÷ (66 × 66)] × 703 = [160 ÷ 4,356] × 703 = 25.8
Both formulas measure the exact same thing, they just use different units. A body mass index chart built in metric units and one built in imperial units will always place the same person in the same category, because BMI is unit-independent once the math is done correctly. This is worth knowing because you may see US sources use pounds and inches while international sources default to kilograms and meters. The categories do not change; only the numbers you plug in do.
If you want to check your own number, the CDC publishes an adult BMI reference tool that uses this exact formula [7]. This article intentionally does not include an embedded calculator, since a static chart plus the formula above is enough for most readers to do the math by hand or with any basic calculator.
BMI Ranges by Age and Life Stage: Adults vs Children
Adults aged 20 and older use the fixed thresholds in the chart above, full stop, no adjustment by decade [7]. That is a deliberate design choice: the same BMI number means the same category whether you are 22 or 62, which keeps the adult chart simple and consistent.
Children and teenagers are a different story entirely, and this is one of the more common points of confusion. For ages 2 through 19, the CDC does not use fixed numeric cutoffs at all. Instead, it plots BMI against age- and sex-specific growth percentiles: healthy weight is roughly the 5th to just below the 85th percentile, overweight is the 85th to just below the 95th percentile, obesity is at or above the 95th percentile, and severe obesity is defined as at least 120 percent of the 95th percentile or a BMI of 35 or higher [7]. The World Health Organization uses a related but distinct growth-reference approach for ages 5 to 19, defining overweight as more than one standard deviation above the median and obesity as more than two standard deviations above it [1][8].
Context matters here: never plot a child or teenager on the adult BMI chart above, and never apply a child’s percentile result to an adult. These are two separate systems built for two separate populations, and mixing them produces meaningless results.
BMI Chart for Women: Same Adult Ranges, Different Contexts
Women aged 20 and older use the exact same BMI categories as men: underweight, healthy weight, overweight, and obesity at the same numeric cutoffs [1][7]. There is no separate female body mass index chart with different thresholds, despite what some consumer apps imply. What changes for women is context, not the ranges themselves.
A few situations where the number needs a second look before drawing conclusions:
- Pregnancy and postpartum recovery. Weight gain during pregnancy is expected and healthy, and BMI calculated during pregnancy or in the months immediately after childbirth does not reflect the same thing it would outside that window. A clinician who is tracking a pregnancy will use pregnancy-specific weight gain guidance, not the standard adult BMI chart, to assess progress.
- Perimenopause and menopause. Hormonal shifts in the 40s and 50s commonly change fat distribution, often shifting more weight toward the midsection even without a large change in total body weight or BMI. This is one reason waist measurement can add useful information that BMI alone does not capture.
- Bone density and muscle mass changes with age. Natural, gradual loss of muscle mass over the decades can mean two women with an identical BMI have meaningfully different body composition and different health pictures.
A sensible starting point is to use the chart above as a reference, note where your number falls, and bring any nearby life-stage context, pregnancy, recent childbirth, menopause transition, into the conversation if you discuss the result with a clinician.
BMI Chart for Men: Same Adult Ranges, Different Contexts
Men aged 20 and older are assessed on the identical adult BMI chart used for women, there is no separate men’s body mass index chart with different numeric boundaries [1][7]. Again, what shifts the interpretation is context, not the categories.
For men specifically, two contexts come up often:
- Higher average muscle mass. Men, on average, carry more lean muscle mass than women at a given body weight, which means BMI can run a little higher in muscular men without necessarily reflecting excess fat. This is especially noticeable in men who do regular resistance training or played contact sports earlier in life.
- Midlife waist changes. Even when BMI stays fairly stable through the 40s and 50s, waist circumference can creep upward as muscle mass declines and fat redistributes toward the abdomen. That is a separate, useful signal, and it is one reason clinicians increasingly pair BMI with a waist measurement rather than relying on BMI in isolation [5].
I would be careful with any chart or app that claims to use different BMI number ranges for men versus women. The core adult categories are shared. If a tool shows you different cutoffs by sex, treat that as a red flag about the tool, not new information about your own health.
When BMI Is Useful
BMI earns its place as a first-pass screening tool because it is fast, free, requires no special equipment, and correlates reasonably well with health risk at a population level [1][10]. It is genuinely useful, within limits, and understanding those limits is what makes it useful rather than misleading.
Where BMI performs its job well:
- Large-scale public health tracking, such as the CDC’s national obesity prevalence surveillance, which relies on standard adult BMI cutoffs applied consistently across millions of survey responses [18].
- A quick, low-cost first flag in a routine physical exam, prompting further conversation rather than standing alone as a conclusion.
- Tracking your own trend over months or years, since the same formula applied consistently to the same person removes a lot of the population-level noise that makes single-point comparisons between different people less reliable.
How to use a BMI chart correctly, step by step:
- Measure height and weight accurately, ideally at a similar time of day and in similar clothing, to reduce noise between readings.
- Calculate BMI using the formula above, or find your height on the adult chart table.
- Note the category, and note how far from the boundary lines you fall.
- Add context: recent life changes, muscle mass, waist measurement, medications, and how you actually feel and function day to day.
- Bring the full picture, not just the number, to any conversation with a healthcare provider.
Common mistake: treating a single BMI reading as a fixed identity rather than one data point in a larger pattern. A number calculated once, in isolation, tells you far less than the same number tracked consistently over time alongside how your clothes fit, your energy levels, and your fitness.
The evidence suggests BMI works best as a conversation starter rather than a conversation ender, and current CDC guidance frames it exactly that way: a screening measure, not a diagnostic one [10].
What BMI Misses: Muscle, Body Composition, Waist Measurement, and Life Stage
Here’s the real issue with BMI: it is a height-to-weight ratio, and it cannot see what that weight is made of. Two adults with the identical BMI can have very different amounts of muscle, fat, and bone, and very different health profiles as a result [3][10].
Is BMI accurate for muscle mass? Does it account for athletes and muscular people?
Not reliably, and this is one of BMI’s best-documented blind spots. A muscular adult, an athlete, a former powerlifter, someone who does regular strength training, can register a high BMI purely from lean mass, with no excess body fat at all [3][10]. In real-world terms, this means a BMI in the “overweight” or even “obesity” range does not automatically mean excess fat if that person is carrying substantial muscle. Clinical interpretation should always include a look at body composition and medical history alongside the number, not the number by itself.
What factors besides weight affect BMI?
- Muscle mass, which adds weight without adding fat-related risk.
- Bone density, which varies naturally between individuals.
- Fluid retention, which can temporarily shift weight without reflecting a change in fat.
- Age-related muscle loss, which can lower BMI even as fat percentage rises, sometimes described as “normal-weight obesity.”
- Pregnancy and postpartum status, covered above.
- Ethnic background. The CDC notes that some East and South Asian populations can develop higher visceral fat and cardiometabolic risk at BMI levels that standard WHO thresholds would classify as healthy, meaning the same number may carry different risk depending on ancestry and body type [10].
Why is BMI not a good measure of health on its own, and what are the alternatives?
BMI cannot measure body fat percentage, cannot identify where fat is stored, and cannot detect organ-level dysfunction. That is not a flaw so much as a design limit: it was never built to do those things. It is not that simple to fix by tweaking the formula, which is exactly why the conversation in 2026 has moved toward pairing BMI with additional measures rather than replacing it outright [2][10].
A widely discussed 2025 clinical framework, now part of ongoing 2026 conversations among researchers, proposes distinguishing “preclinical obesity” (excess adiposity without measurable organ dysfunction) from “clinical obesity” (excess adiposity that has already produced organ-related dysfunction or meaningful functional limitation), and recommends confirming excess adiposity with direct body-fat measurement or additional anthropometric measures such as waist circumference, waist-to-hip ratio, or waist-to-height ratio [2]. A study highlighted in a September 2026 science report found that waist circumference alone, or BMI combined with waist circumference, identified cardiometabolic risk about as well as more complex multi-measure approaches, reinforcing waist measurement as a practical, low-cost add-on to BMI rather than a replacement for it [5].
In real-world terms, a sensible layered approach looks like this:
- BMI as the first, quick screen.
- Waist circumference or waist-to-height ratio as a second data point, especially useful for spotting risk that BMI alone can miss.
- A general sense of fitness and function, how stairs feel, how a short walk feels, how quickly you recover, as a third, very practical signal.
We need to separate fact from hype here: no single number, including BMI, waist circumference, or body-fat percentage, tells the whole story alone. The stronger evidence points to combining a small number of simple measures rather than searching for one perfect metric that does not exist [2][5].
BMI vs Body-Fat Percentage
BMI and body-fat percentage answer different questions, and confusing them is one of the most common mistakes people make when reading a body mass index chart. BMI is a ratio of weight to height; body-fat percentage is an estimate of how much of your total body weight is fat tissue specifically, usually measured through methods like skinfold calipers, bioelectrical impedance scales, or DEXA scanning.
Let’s keep this practical: BMI can be calculated from two numbers you already have, height and weight, using a formula anyone can do by hand. Body-fat percentage requires additional equipment or a specific measurement method, and different methods can give meaningfully different results for the same person on the same day. That is not a reason to dismiss body-fat measurement, it genuinely captures information BMI cannot, but it is a reason to treat the two as separate tools with separate use cases rather than interchangeable numbers.
Clear beats clever on this point: if a chart or app tries to convert your BMI directly into a body-fat percentage estimate without any additional measurement, treat that conversion as a rough approximation only, not a precise reading. A full, dedicated look at body-fat percentage, what it measures, how it is estimated, and where it fits alongside BMI, deserves its own separate discussion, since the two metrics serve genuinely different purposes and shouldn’t be collapsed into one conversation.
Using BMI as a Starting Point for Walking and Cardio
BMI can be one small, useful data point when you are deciding where to start with walking or cardio, but it should never be the reason you feel discouraged before you’ve taken a single step. A sensible starting point is to note your current number, then shift your attention almost entirely to consistency and how your body responds to movement over the coming weeks.
Start with what gives the biggest return: for most beginners aged 45 to 65, that is simply walking regularly at a pace that feels moderately brisk, not BMI optimization. The Exercise Guide for Better Health lays out a broader framework for building a sustainable routine, and How to Start Walking for Exercise breaks down a practical, low-pressure way to begin.
A few honest, non-judgmental next steps:
- Keep it simple and consistent. Three to five short walks a week beats one long, exhausting one, especially in the first month.
- Track how you feel, not just the scale. Energy, sleep quality, stair tolerance, and mood often shift before body weight or BMI does.
- Understand pace and intensity in plain terms using something like the Fat Burn Heart Rate guide, which explains how effort level connects to cardiovascular benefit without requiring guesswork.
- If you are weighing walking against running, the comparison in Walking vs. Running for Weight Loss covers the practical tradeoffs for beginners specifically.
- Explore the full range of options on the exercise hub once walking feels comfortable and you want to add variety.
There is no magic in it: more walking is not automatically better past a reasonable, sustainable amount, and chasing a lower BMI number for its own sake tends to backfire compared with building a routine you can actually keep. The basics still do the heavy lifting here, regular movement, reasonable consistency, and patience with the process.
No promise is made that a lower BMI guarantees a specific health outcome. BMI change is one possible byproduct of a consistent walking or cardio habit, not the point of the habit itself, and plenty of people improve fitness, energy, and function with only modest or no change in BMI.
When to Seek Individual Advice
A body mass index chart is a screening tool, and screening tools exist to flag when a closer, individual conversation is worth having, not to replace that conversation. The main takeaway is this: if your BMI sits well outside the healthy range, if it has changed significantly and unexpectedly in a short time, or if you have other health concerns alongside it, a primary care visit is the right next move.
Seek individualized medical advice, rather than relying on a chart alone, if any of the following apply:
- You are pregnant, recently postpartum, or planning pregnancy.
- Your weight has changed by a notable amount without a clear, intentional reason.
- You have existing conditions such as diabetes, heart disease, or joint problems that affect how exercise should be introduced.
- You are unsure whether a high BMI reflects muscle mass or fat, particularly if you have a strength-training or athletic background.
- You want a fuller picture using body composition testing, bloodwork, or a functional fitness assessment alongside BMI.
- You are starting a new exercise routine after a long period of inactivity or after joint surgery or another medical event.
That is a strong claim and needs strong proof, so to be direct: nothing in this article is a diagnosis, and no chart, including this one, substitutes for an in-person evaluation from a qualified healthcare provider who knows your full history.
FAQ
What is a healthy BMI for my height?
A healthy adult BMI falls between 18.5 and 24.9 regardless of height, though the actual weight range that produces that BMI differs by height, as shown in the chart table above. Check your specific height against the table for an approximate healthy weight range in pounds.
Is the body mass index chart different for men and women?
No. Adults aged 20 and older, both men and women, use the same BMI categories and numeric cutoffs [1][7]. What differs is context, such as typical muscle mass, pregnancy, or menopause-related changes, not the chart itself.
Does BMI account for muscle mass or athletic body types?
No, BMI cannot distinguish muscle from fat, which means muscular or athletic adults can register a higher BMI without carrying excess body fat [3][10]. Body composition assessment and clinical judgment are needed to interpret a high BMI in someone with substantial muscle mass.
Why do doctors still use BMI if it has limitations?
BMI is fast, free, and correlates reasonably well with health risk across large populations, which makes it a practical first screening step [1][10]. Current clinical thinking increasingly pairs BMI with waist measurement or body composition data rather than relying on it alone [2][5].
Is the BMI chart the same for children as adults?
No. Adults aged 20 and older use fixed numeric BMI thresholds, while children and teens aged 2 to 19 are assessed using age- and sex-specific growth percentiles, never the adult chart [7].
What should I do if my BMI falls in the overweight or obesity range?
Treat it as one data point worth discussing with a healthcare provider, not a verdict on your health or effort. A reasonable next step for many beginners is starting a consistent, low-pressure walking routine, alongside a conversation with a doctor if other risk factors or concerns are present.
Conclusion
A body mass index chart gives you a quick, honest first read: one number, four categories, the same adult ranges for everyone aged 20 and up. Evidence first: BMI correlates with health risk at a population level, and it remains a reasonable, no-cost starting point precisely because it is simple [1][7][10]. But simple does not mean complete. Muscle mass, waist measurement, pregnancy, menopause, ethnic background, and general fitness all shape what that single number actually means for you, and current expert thinking increasingly treats BMI as the first step in a short sequence, not the whole assessment [2][5].
I’d rather be accurate than impressive here: no chart, including this one, can tell you everything about your health. What it can do is give you a clear, low-drama starting point, and a reason to look a little further if the number surprises you or sits far from the healthy range. From a practical point of view, the most useful next move for most beginners aged 45 to 65 is not obsessing over the number at all, it is building a walking or cardio habit that fits real life, checking in with a doctor if anything about your number or your health feels uncertain, and letting consistency do the work over months, not days. Truth over hype: BMI is a tool worth understanding, not a target worth chasing for its own sake.
References
[1] Obesity And Overweight – https://www.who.int/news-room/fact-sheets/detail/obesity-and-overweight [2] onlinelibrary.wiley – https://onlinelibrary.wiley.com/doi/full/10.1002/oby.70150 [3] S12966 025 01719 6 – https://link.springer.com/article/10.1186/s12966-025-01719-6?error=cookies_not_supported&code=d4c1bfd9-4593-4965-bf3c-dd1ef924177c [5] sciencedaily – http://www.sciencedaily.com/releases/2026/08/260829035208.htm [7] Bmi Categories – https://www.cdc.gov/bmi/adult-calculator/bmi-categories.html [8] Help – https://apps.who.int/nutrition/landscape/help.aspx?menu=0&helpid=420 [10] 25 0222 – https://www.cdc.gov/pcd/issues/2025/25_0222.htmMedical Disclaimer

Dave writes practical, evidence-aware health guidance that helps readers make steadier decisions without chasing extremes.
📂 Exercise Guide for Better Health
This article is part of the APH cluster. Use the links below to move between the pillar and child articles.
- Read the pillar: Exercise Guide for Better Health
- YOU ARE HEREBody Mass Index (BMI) Chart
- → How to Start Walking for Exercise
- → HIIT Workouts
- → Walking vs. Running for Weight Loss
- → Fat Burn Heart Rate
- → Zone 2 Cardio: A Practical Beginner’s Guide to Steady Aerobic Training
- → Health Benefits of Swimming
- → Explore all Exercise guides